
Capture the brain dump so it can become architecture
A 60-minute engineering brain dump usually contains everything you need for a solid C4 diagram. The problem is shape, not substance. People talk in loops, jump layers, and mix decisions with anecdotes. The “prompt-to-architecture” playbook is a lightweight way to convert that raw text into a shareable C4 view without opening a diagramming tool.
The core idea: you don’t “draw” architecture first. You extract structure, then render it from text. Tools like napkin.ai fit this workflow well because they act like a text-to-visual translator: you focus on writing accurate relationships, then turn them into visuals you can iterate on.
What you’re producing in C4 terms
C4 is easiest when you treat it as four separate deliverables, not one mega-diagram:
- Level 1: System Context — Who uses the system and which external systems interact with it.
- Level 2: Container — The deployable units (web app, API, worker, database, queue) and how they communicate.
- Level 3: Component — Major modules inside one container and their responsibilities.
- Level 4: Code — Optional; usually replaced with links to code and a few key interfaces.
This playbook targets Levels 1–3 because they’re the highest leverage for sharing across engineering, product, and ops.
Step 1: Run the 60-minute dump with a strict capture template
Don’t just record a meeting transcript. Ask one person to paste notes into a structured outline as the conversation happens. Use this template and keep it blunt:
- Goal: What outcome does the system enable?
- Actors: End users, internal users, automation.
- External systems: Vendors, identity providers, payment, email, analytics.
- Core containers: UI, API, workers, data stores, queues, caches.
- Key flows: 3–5 user or system journeys (signup, checkout, sync, report generation).
- Data: Main entities and where the source of truth lives.
- Non-functional constraints: Latency, consistency, privacy, regions, SLA.
- Open questions: Anything you can’t confidently diagram yet.
If you already use a structured intake process for requests and changes, align the “Open questions” section with your backlog method so diagram gaps become trackable work rather than lingering ambiguity. The approach in an issue intake contract for a prioritized backlog maps well to architecture follow-ups.
Step 2: Convert messy notes into “diagram-ready sentences”
A diagram without a tool still needs a diagram language. The easiest one is plain sentences that are unambiguous. Rewrite the brain dump into short statements with consistent verbs:
- Uses: “Customer uses Web App.”
- Calls: “Web App calls Public API over HTTPS.”
- Publishes: “API publishes OrderCreated event to Queue.”
- Consumes: “Worker consumes OrderCreated events.”
- Reads/Writes: “API writes Orders to Postgres.”
- Authenticates: “Web App authenticates via Okta.”
Two rules keep this clean:
- One relationship per line. No “and then” chains.
- Name things consistently. Pick one label for each system/container and reuse it exactly.
This rewrite step is where most time is saved later. A good diagram is mostly good naming.
Step 3: Build Level 1 System Context from the outside in
Start with the actor’s world. A context diagram is usually readable even to non-engineers, so keep it simple:
- List 1–3 primary actors.
- Add external systems only if there’s a real dependency.
- Define what data crosses each boundary (e.g., “sends payment token,” “receives shipping status”).
Common failure mode: stuffing the context diagram with internal components. If it runs in your infrastructure, it probably belongs in Level 2, not Level 1.
Step 4: Build Level 2 Container by mapping deployables and protocols
Containers are where the brain dump usually gets noisy. Keep the diagram grounded in deployable units and the communication paths between them:
- UI: web, mobile, internal admin.
- API surface: public API, internal API, gateway/BFF.
- Async: queues, topics, event bus.
- Compute: background workers, scheduled jobs.
- Storage: OLTP database, object storage, search index, cache.
Add protocols when they clarify behavior: HTTPS, gRPC, webhook callbacks, batch file drops. If a flow depends on timing (e.g., retries, eventual consistency), annotate it in text next to the relationship rather than adding more boxes.
Step 5: Build Level 3 Component only for the container that needs clarity
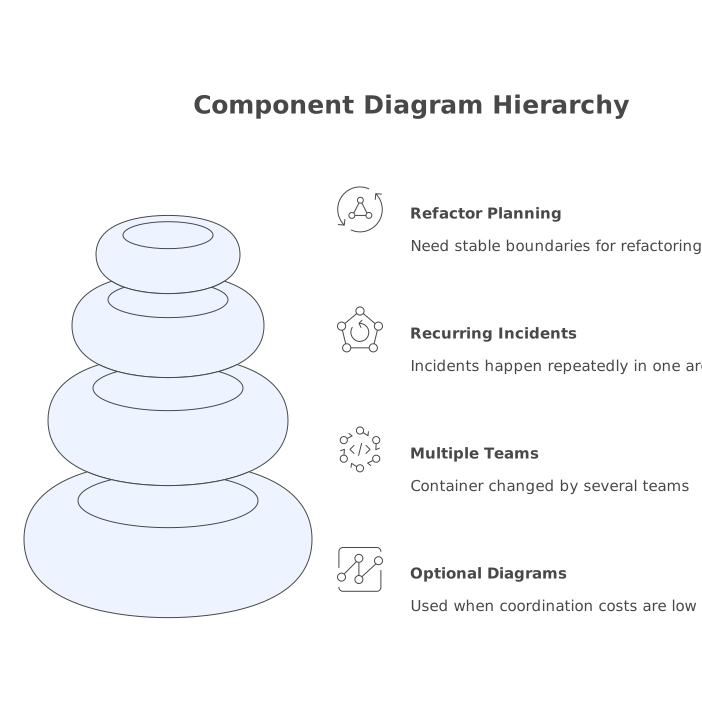
Component diagrams are optional until there’s a real coordination cost. Use them when:
- A container has multiple teams changing it.
- Incidents keep recurring in the same area.
- You’re planning a refactor and need stable boundaries.
Pick one container (often the API) and break it into 5–9 components max. For each component, write:
- Responsibility (what it owns)
- Inputs/outputs (APIs, events, tables)
- Dependencies (other components, external systems)
When the list grows beyond 9, it’s a smell that you’re drifting into code-level detail.
Step 6: Turn the text into a shareable visual without a diagramming tool
Once you have diagram-ready sentences, you can generate visuals directly from the text. The practical workflow looks like this:
- Paste your Level 1 sentences into a document labeled “C4 L1 System Context.”
- Paste your Level 2 sentences into “C4 L2 Containers.”
- Paste your Level 3 sentences into “C4 L3 Components (API).”
- Use a text-to-visual tool to render and iterate from the same source text.
With napkin.ai, you can start from the written relationships and quickly produce a clean visual that’s easy to adjust and export. That matters because architecture diagrams rarely get “finished”; they get revised as decisions harden.
Step 7: Add a lightweight “truth layer” so the diagram stays current
Diagrams decay when they don’t have an owner or update trigger. Keep this minimal:
- Owner: one name on the diagram (not a team).
- Last updated: a date line.
- Change triggers: “Update when: new external dependency, new container, auth model change.”
If your team struggles with work staying “in progress” forever, tie diagram updates to explicit WIP limits so documentation doesn’t become invisible work. The WIP budget playbook for capping in-progress work is a good way to formalize that without adding meetings.
Step 8: Share the diagram with the right reading path
A shareable C4 diagram isn’t just an image. Ship it with a short reading guide:
- Audience: “For onboarding” vs “for incident response” changes what you emphasize.
- Top 3 flows: link each flow to the containers/components involved.
- Assumptions: call out what might be wrong or pending.
The result is an artifact people can trust, critique, and keep updated—built from one hour of conversation and a disciplined text rewrite, not from fiddling with shapes.
Vertical Video