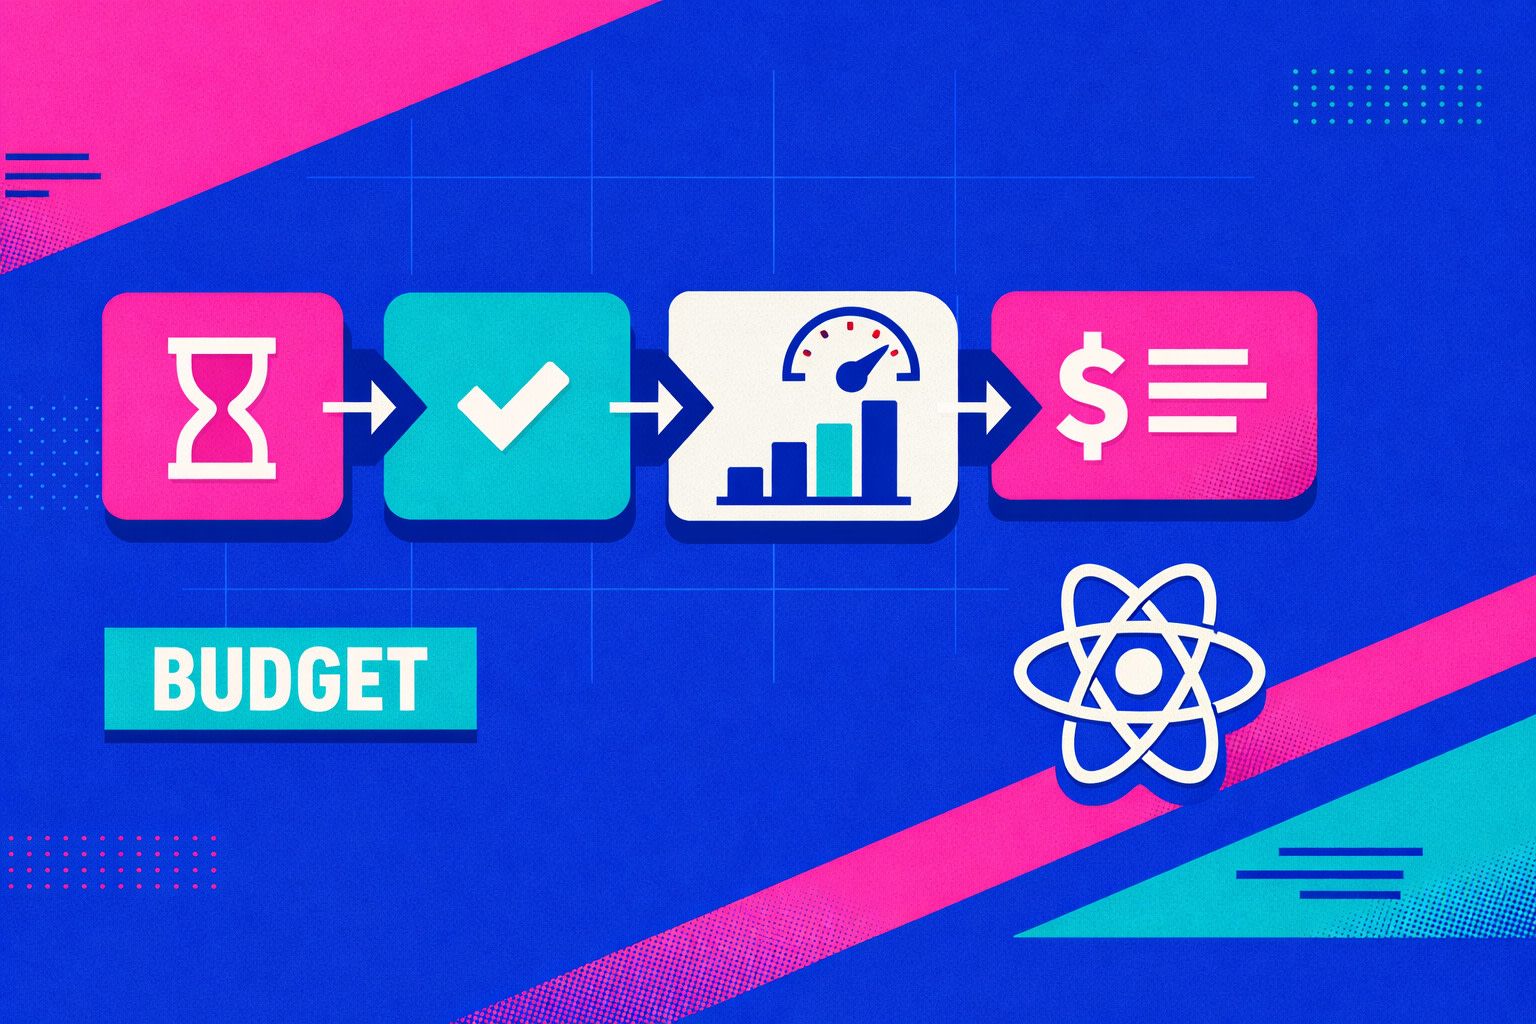
Set a performance budget before “one-click deploy” becomes a surprise
AI-generated React apps tend to ship fast and drift slowly. A new component lands, Tailwind grows, images creep in, and the first real users feel it as slower loads and jank. The fix is not a one-time Lighthouse run. It’s a repeatable pre-launch workflow that enforces a performance budget in CI, watches real-user metrics, and blocks accidental bundle growth.
This guide outlines a practical setup built around Lighthouse CI, Web Vitals, and Tailwind bundle guards. It fits well when your app is generated and iterated in a standard stack (React + Tailwind + Supabase) and then deployed in a single step. If you’re building in lovable.dev and syncing to GitHub, this is especially clean: the “budget” lives next to the code from day one and travels with every iteration.
What to budget and why it works
A performance budget is a set of thresholds that fail a build when exceeded. The point is not perfection. It’s predictability. Your budget should cover three layers:
- Lab metrics you can enforce pre-launch: Lighthouse Performance score, LCP, TBT, CLS.
- Real-user metrics you can track post-launch: Core Web Vitals and related Web Vitals signals.
- Asset and CSS growth that predicts future pain: JS bundle size, CSS size, and “Tailwind bloat” patterns.
These layers complement each other. Lighthouse CI catches regressions before deploy. Web Vitals tells you if lab expectations match reality. Bundle guards prevent the slow creep that makes both worse over time.
Step 1: Standardize a “budget run” environment
Performance checks only matter if they’re repeatable. Define one way to build and serve the app for audits, and don’t vary it between local, CI, and pre-launch.
- Use a production build:
npm run buildor your framework equivalent. - Serve it with a simple static server (or preview environment) that mirrors production headers and compression as closely as possible.
- Lock Node and package manager versions in CI to avoid “it passed yesterday” issues.
If you rely on dynamic data, seed the environment with predictable fixtures. For Supabase-backed apps, prefer a dedicated preview project or seeded data so the page doesn’t randomly vary with empty states or large lists.
Step 2: Add Lighthouse CI as the build gate
Lighthouse CI (LHCI) is the enforcement mechanism. The key is to stop treating Lighthouse as a report and start treating it as a test suite.
What to measure
- Performance score as a coarse guardrail.
- LCP to protect perceived load speed.
- TBT to protect interactivity and long tasks.
- CLS to prevent layout shift regressions.
How to make it stable
- Run multiple times and use a median/average to reduce noise.
- Test a small set of representative URLs: landing page, a heavy “app” screen, and an authenticated route if relevant.
- Throttle consistently (desktop/mobile profiles) rather than relying on whatever the CI runner provides.
In GitHub Actions, the workflow is typically: install → build → serve → run LHCI. Then fail the PR if any metric exceeds thresholds. This is the “zero surprises” layer: if it would hurt users, it should hurt the build first.
Step 3: Track Web Vitals after deploy, not just in audits
Lighthouse is lab data. Web Vitals are real-user signals. You want both, because real devices, real networks, and real user flows expose issues that lab runs don’t.
Instrument Web Vitals in the app and ship the metrics to your analytics pipeline (first-party endpoint, your existing event system, or GA4). Track at least:
- LCP (Largest Contentful Paint)
- INP (Interaction to Next Paint)
- CLS (Cumulative Layout Shift)
Use the data in two ways:
- Regression detection: compare deploy-to-deploy and alert when p75 shifts.
- Budget calibration: if lab budgets are too strict or too loose, adjust thresholds based on production reality.
If you already have an event strategy, fold Web Vitals into it. If you don’t, build a minimal first-party collection route. For teams avoiding cookies, it helps to treat these as product quality events rather than marketing identifiers; the approach aligns with measuring engagement via first-party signals (see estimating visitor engagement without cookies for a broader event mindset).
Step 4: Add Tailwind bundle guards to prevent CSS drift
Tailwind is great for velocity, but it can also create hidden performance debt when class usage expands, dynamic class composition defeats extraction, or a component library pulls in unused styles. A “Tailwind bundle guard” is simply a check that your compiled CSS stays within a budget and remains purgeable.
Practical guards that work
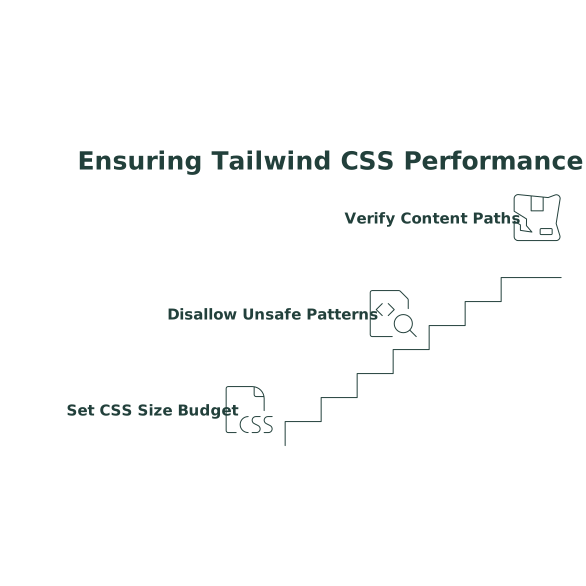
- Compiled CSS size budget: fail CI if the production CSS artifact exceeds a threshold.
- Disallow unsafe patterns: lint for dynamic class strings that Tailwind can’t statically analyze (common with AI-generated code).
- Verify content paths: ensure Tailwind’s content configuration covers all templates/components so unused classes are removed.
This is where AI-generated UI can bite you: it often introduces many one-off styles and variants quickly. A CSS budget forces the team to consolidate components, remove dead UI, and avoid “just in case” styling.
Step 5: Guard JavaScript bundles and route-level weight
JS is usually the biggest performance swing factor in React apps. Add a bundle analysis step and enforce budgets. The goal is not to micromanage every dependency; it’s to catch “one PR added 400 KB” before it hits production.
- Total JS budget: cap main bundle + critical chunks.
- Route budget: cap worst-case routes (dashboards, editors, search pages).
- Dependency alerts: flag new large libraries or duplicated packages.
Common wins include code splitting, lazy-loading admin-only features, replacing heavy date/chart libraries, and removing unused polyfills. If you also run automated security checks, keep performance and security separate in the pipeline so performance failures don’t get ignored as “scanner noise.”
Step 6: Make the workflow pre-launch by default
The workflow is only useful if it runs on every meaningful change. A practical pattern is:
- On pull requests: run bundle/CSS guards and a fast Lighthouse CI set (few URLs).
- On main branch merges: run full LHCI across more URLs and upload reports to a central store.
- On deploy: verify Web Vitals instrumentation is live and dashboards update per release.
To keep it from becoming process overhead, define a single “performance budget contract” that everyone can read: what’s measured, thresholds, and what to do when it fails. Treat failures like you treat tests: fix, or explicitly approve a budget change with a reason. That mindset pairs well with an intake contract for prioritizing work and reducing ad-hoc pings (issue intake contract covers the pattern).
Recommended default budgets to start with
You’ll need to tune for your app, but reasonable starting targets for a typical React/Tailwind app are:
- Lighthouse Performance: keep a minimum score threshold per page type (stricter for marketing pages, slightly looser for heavy app routes).
- CLS: aim for near-zero layout shift; treat any regression seriously.
- LCP: enforce improvements on image-heavy pages by optimizing hero assets and critical rendering.
- TBT/INP: protect interactivity by limiting main-thread work and deferring non-critical scripts.
- CSS and JS size caps: keep hard ceilings that match your expected user devices and markets.
The most important part is not the exact numbers. It’s having numbers at all, enforced automatically, so your “one-click deploy” pipeline stays boring—in the best way.